CBO’s Demographic Projections Highlight Importance of Immigration

In July of 2022, the Congressional Budget Office (CBO) released a report projecting demographic trends in the U.S. for the next 30 years. The Demographic Outlook: 2022 to 2052 provides population projections that underlie the CBO’s baseline budget projections and economic forecast published in May 2022, and long-term budget projections published in July 2022. Among other things, these projections help determine the expected impact on the social security system.

Two take-aways from the report are similar to the findings of other projections of U.S. population growth: the growth of the U.S. population is slowing, and immigration will be an increasingly important contributor to population growth.

Population Growth

The U.S. population is projected to grow by 0.3 percent per year, on average, over the coming 30 years. For comparison, population growth over the previous 40 years averaged 0.9 percent. Within the overall growth of the population, the cohort that is 65 or older will grow at a faster rate than younger cohorts. The number of people in their prime working years, age 25 to 54, will grow at an average annual rate of 0.2 percent. By contrast, that cohort grew by 1 percent on average during the period 1980 to 2021. In 2022, the number of people in their prime working years relative to those who are 65 and older (and generally retired or about to retire and drawing Social Security) is 2.3 to 1. By 2052, that ratio will be 1.7 to 1.

Immigration

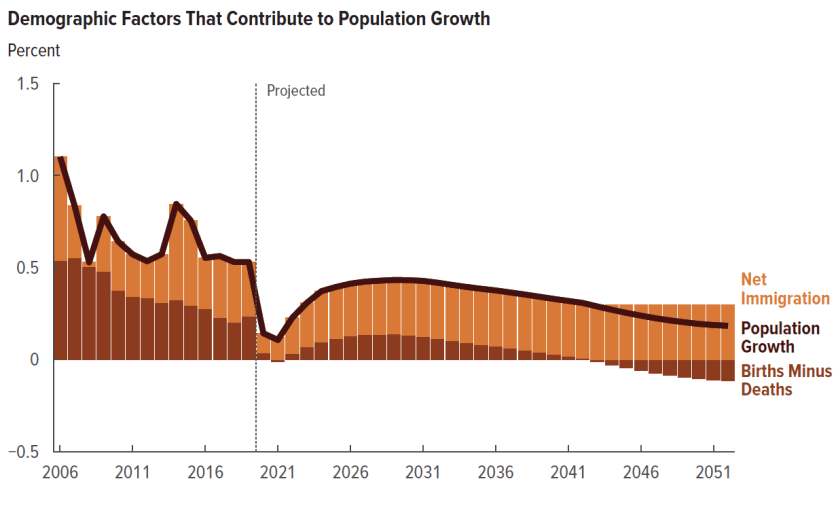
Over the projection period, fertility rates remain below the replacement rate, and so immigration will increasingly drive population growth. CBO projects immigration to gradually rise to 1.1 million by the third decade of the projection period. (This is still 400,000 below the average net immigration in the early 2000s, prior to the Great Recession.) Over the next decade, immigration will account for about 75 percent of population growth. By 2043, immigration is projected to account for all of U.S. population growth.

Where Assumptions Could Go Awry

The CBO Notes that fertility rates in the U.S. averaged 2.02 children per woman in 1987 – 2007 period. In 2007, the rate peaked at 2.12. During the Great Recession, the rate began to decline, falling to 1.64 children per woman by 2020. CBO assumes the rate will rise to 1.75 births per woman by 2030. It is not hard to imagine, however, that another period of economic instability could create conditions for another downturn in the fertility rate.

The CBO projects mortality rates to decrease, with life expectancy rising by approximately five years by 2052. However, from 2015 to 2017, life expectancy in the U.S. actually declined — driven by suicides and drug overdoses, and life expectancy declined again in 2020, driven by COVID-19. It is not hard to imagine periods of life expectancy declines over the next 30 years. For example, the lethality of future pandemics might be increased due to the substantial percentage of Americans who don’t trust measures to protect us from deadly viruses. Also, it is not hard to imagine that, in an increasingly polarized society, violence may alter mortality projections. By 2020, for example, gun violence became the leading cause of death among children ages 19 and under.

Immigration is another area where there could be significant deviations from what is projected. CBO notes that, while net immigration averaged 1.5 million between 2000 and 2006, it fell considerably during the Great Recession. It never recovered by the time policies of the previous administration slowed immigration, and policies enacted during the COVID-19 pandemic caused a steep drop in immigration flows. Policies of future administrations could significantly impact these CBO projections.

If any of these rates (fertility, mortality, immigration) were to deviate significantly from CBO projections, the effects on the future workforce could be significant. For example, of the more than one million deaths due to COVID, approximately 260,000 of them were below retirement age (and more likely than not in the workforce). Between 2017 and 2022, the sharp downturn in net immigration removed 3.2 million potential workers from the workforce, contributing to our current labor shortage.

This report reinforces other population projections which have emphasized the importance of immigration to U.S. population growth a — and to the growth of our workforce.

BPC Releases Report on Reforming Employment Immigration

Reforming Employment-Based Immigration: Charting a Path Forward
Bipartisan Policy Center
July 2022

In July, the Bipartisan Policy Center published a report that summarized conversations that took place among groups of stakeholders who were convened to discuss possible reforms to the U.S. employment-based immigration system. The stakeholder groups convened by BPC represented labor, employers, and immigrant rights advocates. The starting point was polling conducted by BPC in 2021 showing that the public was more likely to reach consensus on immigration reforms that focused on “providing visas for immigrants supporting U.S. economy by filling positions where companies cannot find U.S. workers.”

The groups were encouraged to think about an immigration system re-designed from the ground up, instead of tweaking current immigration laws. There were working groups focused on high-skilled and lesser-skilled immigration.

Policy proposals resulting from these discussions resemble those of similar efforts to prescribe solutions for our broken immigration system that have been undertaken over the past three decades — including, for example, the Independent Task Force on Immigration and America’s Future, convened by the Migration Policy Institute and others in 2005 and 2006.

In the BPC convening, both high-skilled and lesser skilled working groups agreed the immigration system currently lacks transparency and clarity, and that makes it difficult for workers and employers to make long-term plans. The immigration system should clearly define how the immigration system aligns with the national interest, and balances the needs of workers and employers.

Some of the policy prescriptions discussed within the working groups include:

  • Clearer pathways to transition from temporary to permanent status, and more opportunities to do so.
  • More permanent visas to balance the current over-reliance on temporary visas, including opportunity for those who can fill demonstrated labor needs regardless of education or skill level.
  • A streamlined process that is less arduous for immigrants and employers.
  • A labor certification process that ensures that workers entering the country are complementary to U.S. workers, and not competing for the same positions.
  • Increasing visa portability, so that workers can more easily move from one employer to another, while providing employers with some assurance that workers will stay for some period of time so that time and resources spent on the visa application and training may be recouped.
  • Provide greater opportunity to reward with permanent status those who have built equity in the U.S. — for example, foreign students educated and trained in the U.S., or seasonal workers who have completed multiple cycles of seasonal work.

The report also identifies areas where consensus between employer groups and labor and immigrant advocates was more difficult — including the continued use and regulation of recruiters, and the proper balance between employer concerns and workers rights.

Who Decides?

The working groups convened by BPC echoed the recommendations of others regarding how immigration levels are set and changed. The process should be somewhat insulated from politics, by having an independent group of experts determine immigration levels based at least in part on labor market needs. Congress would no doubt retain some role, but the system should have built in to it some method to ensure timely Congressional action.

The ideas presented in this report, as well as other policy proposals for fixing our immigration system offered over that past 30 years face the same obstacle: a lack of political will in Congress to make the needed changes. This report acknowledges that fact by concluding that:

Clarifying the ineffectiveness of the legal immigration system, its failure to work as intended for all involved, and its impact on the other aspects of the immigration system, from border control to undocumented immigrants, is needed to push the issue forward in Congress.

Image credit: Russ Allison Loar/Creative Commons

CBP’s Annual Entry and Exit Data Report

Every year, U.S. Customs and Border Protection (CBP) provides data to Congress on the number of nonimmigrants who enter the U.S., and the number of departures corresponding to those entries. From these numbers, the government calculates the number of nonimmigrants who are suspected to have stayed in the U.S. beyond the authorized period of admission. Dividing this number by the expected number of departures yields the overstay rate.

All foreign nationals arriving in the U.S. provide biographic information to CBP officers, and for most, CPB also collects biometric data — fingerprints and photographs.

For departing travelers, the collection of biographic and biometric data is more complicated. As the report notes, “…transportation hubs and border infrastructure in the United States were not constructed with exit processing in mind.” For example, international air travelers are familiar with the experience of being funneled into room where CBP officers are waiting to ask you questions and inspect your documents. There is no comparable room for departing international passengers. Instead, commercial airlines provide biographical information about departing passengers. CBP has begun to deploy technology to capture biometric data (photographs, and facial recognition technology) in airports, but thus far the use of this technology is limited. In FY 2020, approximately 13 percent of noncitizens air travelers departing the U.S. had their biometric data captured and matched with entry data.

Land ports of entry (POEs) present greater challenges. First, it isn’t feasible to obtain advance information of arrivals and departures, as most travelers arrive by car or on foot, and thus there is no passenger manifest such as those provided by air carriers. But travelers are inspected upon arrival. BPB is testing facial recognition technology on car passengers arriving and departing one land POE in Texas, and will evaluate the success of that technology for possible wider deployment.

In the meantime, outbound travelers at the southern border may be subject to “pulse and surge” operations, where CBP collects biometric data with mobile devices.
For the northern land border, the U.S. and Canada are exchanging biographic entry data, so that when someone enters Canada, it is recorded as a departure from the U.S. This agreement applied to third-country nationals crossing the U.S./Canada border. On the southern border, for many individuals who are repeat border crossers, the U.S. records a departure for an individual when that individual re-enters the U.S.

The report explains what happens when the data shows an individual has not departed as expected. There are two types of overstays — Out-of-Country Overstays, where an individual fails to depart when required by the term of his or her admission, but subsequently departs, and Suspected In-Country Overstays, where the individual fails to depart and remains in the country. In the first group, individuals may be denied entry to the U.S. in the future. In the second group, lists are generated and examined by DHS for possible enforcement action, depending on set enforcement priorities.

The report contains tables breaking down statistics on overstays by Visa Waiver Program (VWP) nonimmigrants (nationals of countries for which the U.S. does not require visitors to obtain a visa) and non-VWP nonimmigrants (who must first apply for a visa before traveling to the U.S.). Tables are also broken down by visitors for business or pleasure, students and exchange visitors, and all others. (A few classes of nonimmigrants — diplomats, for example — are not included in the entry-exit data.)

For Fiscal Year 2020, the three Visa Waiver countries with the highest Suspected In-Country overstay rates in the visitor categories (out of 40 participating countries) were Brunei (2.01%); Portugal (1.90%) and Chile (1.53%). But some of these countries have few visitors, and a relatively high overstay rate does not mean there are many persons thought to have overstayed and remain in the country. For example, there were only 747 persons expected to depart from Brunei, and only 15 are suspected to remain in the country after their approved length of admission expired. The top three countries in number of Suspected In-Country overstays were the United Kingdom (19,635); Spain (11,395); and France (10,551).

For non-VWP countries, the corresponding statistics were Chad (24.78%); Djibouti (23.03%); and Sudan (22.31%). But in numbers: Brazil (46,711); Venezuela (31,599); and Columbia (30,479).

For students and exchange visitors, the top Suspected In-Country overstay rates were from nationals of Libya (49.83%); Burundi (36.36%); and Eritrea (32.35%). Numerically, the top countries were China (3,809); India (2,632); and Brazil (1,563).

The report, “Fiscal Year 2020 Entry/Exit Overstay Report” (September 30, 2021) is available on the DHS website HERE.

Image from Ars Electronica, under Creative Commons license.

He’s Gotta Have It

golf_course_worker

President Trump has been insistent that Congress give him money to build a wall on the southern border — that structure of concrete or steel slats that will somehow magically stop illegal immigration (even though, these days, most undocumented immigrants arrive with visas and do not depart when their visa expires).

Thanks to a lengthy Washington Post article published on February 8th by a team of journalists, including Pulitzer Prize-winner David Farenthold, we learned there is something else Mr. Trump must have. At the same time that Donald Trump has staked his presidency on building The Wall, he has staked his business success on the availability of undocumented workers he is trying to keep out as president.

The Post article tells the story of the undocumented workers who tended grounds, provided housekeeping services and worked in the kitchen of Trump’s golf course in Bedminster, New Jersey. The article notes that, in the estimation of the workers interviewed, more than 100 undocumented workers labored at the Bedminster golf course at one time. And Bedminster is not the only Trump property that employed undocumented workers. Continue reading “He’s Gotta Have It”

When do we give them a break?

There have been a pair of reports released recently with new estimates of the undocumented immigrant population in the U.S. A report by the Pew Research Center, released in November, provides a wealth of information on the size and demographic characteristics of the undocumented population as of 2016. These estimates are compared to population estimates calculated in 2007.

Another report by the Center for Migration Studies (CMS) takes a look at trends in the undocumented population between 2010 and 2017.

The headline is that the undocumented immigrant population has declined significantly. Pew estimated the undocumented population to be 10.7 million in 2016 — down from its 2007 peak of 12.2 million. It is as low as it has been since 2004. The estimate includes individuals who are now living with temporary protection from deportation through two programs — Temporary Protected Status (TPS), covering approximately 317,000 people, and Deferred Action for Childhood Arrivals (DACA), which protects approximately 700,000 persons from deportation. The Trump administration is trying to end both of these programs.

pop_2016_2007
Source: Pew Research

According to Pew, undocumented immigrants now make up less than a quarter (24 percent) of the total immigrant population in the U.S., down from 2007 when it was nearly a third (30 percent).

The decline is attributed primarily to a sharp decline in the number of Mexicans entering without authorization, and the departure of Mexican undocumented immigrants. CMS estimated that, since 2010, the undocumented Mexican population has declined by 1.3 million and, in 2017 for the first time, undocumented immigrants from Mexico constituted less than half of the U.S. undocumented population. Continue reading “When do we give them a break?”

The Missing One Percent

GDP-Growth-Table

Recently, Robert Samuelson wrote a column for the Washington Post in which he discussed different projections for future economic growth. On the one hand, he noted that a recent White House economic report includes a projection of 3 percent economic growth per year for years to come.

On the other hand, most economists project slower growth. In part, this is due to the slow growth projected for the U.S. labor force. As Samuelson illustrates, the Congressional Budget Office is projecting labor force growth of 0.5 percent annually over the next 10 years. Productivity growth is projected to be 1.3 percent annually. Adding these together gets economic growth to 1.8 percent per year—more than one percent short of the White House’s rosy projections.

What Samuelson does not talk about in his column is immigration.

Continue reading “The Missing One Percent”

Immigrants in our Armed Forces

6305780267_a2011e9749_b

Immigrants have been serving in our armed forces since the beginning of our republic. At times, a significant portion of our military was foreign-born. Roughly a quarter of the Union Army during the Civil War was foreign-born. Our military force was 18 percent immigrant in World War I. During World War II, Congress made it easier for immigrants serving in the military to become naturalized citizens.

In 2015, about 40,000 immigrants were serving in our armed forces, and about 5,000 noncitizens enlist each year. Approximately 11 percent of all veterans are either foreign-born, or came from families where at least one parent was an immigrant. About 20 percent of our Medal of Honor winners are immigrants.

Military service has always been a tool for integration, as military service offers equal opportunities for promotion, future education, and skills training.

Willing and Able Recruits Barred from Service

Immigrants will continue to be an important component of the armed forces in the future. With the economy continuing to recover from the Great Recession of the late 2000s, there are more opportunities in civilian markets, and military recruiters are having more difficulty finding eligible young people willing to serve. For a variety of reasons, only 13 percent of 17- to 24-year-olds were eligible to serve in 2015. Of a total target recruitment population of 33.4 million, the Army estimates that just 0.4 percent would be qualified and willing to serve, according to the Army Times.

Despite a more challenging recruitment environment, a large number of potential recruits are kept from enlisting in the military. These are young people who were brought to the U.S. as children, and have grown up here. Many of these individuals would be eligible for the DREAM Act, which provides a path to legal status through military service (as well as education). Congress has failed to pass the measure on several attempts in the last decade, and the bill is again before Congress. Many high-ranking military officials have supported the DREAM Act in the past, as it would add to the pool of potential recruits the military needs. Continue reading “Immigrants in our Armed Forces”

In Wake of NY Attack, Opportunists Call for End of Diversity Program


Hudson River Park, Manhattan

On October 31, an individual drove a pickup truck on a bike path in New York City, killing eight in an act of terrorism. The driver of the truck, Sayfullo Saipov, was a U.S. legal permanent resident originally from Uzbekistan. Mr. Saipov came to the U.S. after winning a visa through the Diversity Immigrant Visa Lottery program.

A terrorist attack pretty much guarantees a chorus of political opportunists putting forth their ideas to cut immigration. This incident was no exception. Immigration hardliners in Congress wasted no time in calling for an end to the diversity visa lottery. And, no surprise, the President called for the elimination of the diversity visa.

Diversity Visa Origins and Purpose

The American immigration system favors immigrants with close family ties to the U.S., and most immigrants enter through the sponsorship of a U.S. citizen or permanent resident immigrant. Over time, our immigration stream became dominated by a relatively few countries. In 2015, for example, out of the 1,051,000 persons obtaining lawful permanent residence (“green cards”), 46 percent came from seven countries (Mexico, China, India, the Philippines, Cuba, the Dominican Republic, and Vietnam).

Except through employer sponsorship, there were few opportunities for nationals of most countries to come to the U.S. For example, although millions of Americans claim some Irish ancestry, the family linkages to Ireland are too remote to qualify for U.S. immigration. If you are Irish and have a grandparent who is a citizen of the U.S., you are out of luck—U.S. citizens may only sponsor spouses, parents, children (including adult children), and brothers and sisters. Because American ties to Ireland are generally more remote than the immediate family, very few Irish had an opportunity to immigrate. The same was true of other nationalities that gave us our immigrant heritage—including the countries from which individuals were brought involuntarily as slaves.

Continue reading “In Wake of NY Attack, Opportunists Call for End of Diversity Program”

“Sanctuary Cities” and Community Policing

15207585161_76b9582230_k


A version of the following was written as a backgrounder on the issue of “sanctuary cities,” prepared for a teach-in on the City of Takoma Park’s “sanctuary” ordinance on February 4, 2017. The event attracted more than 350 people. You can download a version of this issue brief as a PDF from this link.

Executive Order on Interior Enforcement

On January 25, 2017, President Trump signed an executive order that would, in part, punish any local jurisdiction that has adopted certain community policing tactics designed to establish trust between local law enforcement and communities where there is a significant immigrant population.

The executive order included a section tilted “Sanctuary Jurisdictions.” The order stated in part: “It is the policy of the executive branch to ensure, to the fullest extent of the law, that a State, or a political subdivision of a State, shall comply with [federal law having to do with prohibiting jurisdictions from banning communication between local officers and federal immigration officers].” The order directs the Attorney General (AG) to “take appropriate enforcement action against any entity … which has in effect a statute, policy, or practice that prevents or hinders the enforcement of Federal law” and it directs the AG and Secretary of Homeland Security to ensure that jurisdictions that do not comply are not eligible for federal grants.

Community Policing and Undocumented Immigrants

The term “sanctuary jurisdiction” has no legal or common definition, but states and localities that have some formal or informal policy limiting cooperation between their local law enforcement agencies and federal immigration authorities are often called “sanctuary” jurisdictions.

Many communities with significant immigrant populations have community policing policies to keep local law enforcement agencies out of the business of federal immigration enforcement. In doing so, they seek to build trust between local police and the community—including the immigrant community—so that community members feel they can safely approach police to report a crime or volunteer information about a crime. Public safety of the entire community is placed in jeopardy if immigrants fear the local police because they believe they will be deported.

A 2006 position paper by the Major Cities Chiefs states the problem for police:

Major urban areas throughout the nation are comprised of significant immigrant communities. … Local agencies are charged with protecting these diverse populations…. The reality is that undocumented immigrants are a significant part of the local populations major police agencies must protect, serve and police. Local agencies have worked very hard to build trust and a spirit of cooperation…. If the undocumented immigrant’s primary concern is that they will be deported …, then they will not come forward and provide needed assistance and cooperation.

Continue reading ““Sanctuary Cities” and Community Policing”

Rising Prices Make Housing Unaffordable for Immigrants in California Cities

15399858287_ed547715af_k

The California Immigrant Policy Center recently released its annual report on the economic contributions of immigrants to California’s economy. The contributions are huge–$715 billion, or one-third of the state’s total output. And the state’s total GDP makes it the sixth largest economy in the world. Undocumented immigrants alone contribute an amount equal to the entire output of the economy of Oklahoma.

The continued ability for immigrants in California to play such a crucial role in the economy is being undermined, however, by rising inequality and housing prices that are increasingly unaffordable for immigrants at the low end of the pay spectrum.

The study takes three examples of neighborhoods in Los Angeles and San Francisco that traditionally housed an immigrant population and shows that, with housing costs rising in these neighborhoods, the immigrant population has been declining.

Read more of my summary of the California Immigrant Policy Center’s study over on Immigration Impact.

Photo credit: Luke Price under Creative Commons License 2.0.